Water statistics
| Year | Households (m3) | Others (m3) | Total amount (m3) |
| 2002 | 592.184 | 346.072 | 938.256 |
| 2003 | 585.424 | 358.290 | 943.714 |
| 2004 | 616.963 | 363.359 | 980.322 |
| 2005 | 588.604 | 366.909 | 955.513 |
| 2006 | 575.878 | 344.216 | 920.094 |
| 2007 | 602.948 | 316.565 | 919.513 |
| 2008 | 587.168 | 328.534 | 915.702 |
| 2009 | 540.165 | 323.915 | 864.080 |
| 2010 | 533.825 | 329.885 | 863.710 |
| 2011 | 506.026 | 347.940 | 853.966 |
| 2012 | 499.897 | 350.776 | 850.673 |
| 2013 | 492.567 | 331.642 | 824.209 |
| 2014 | 487.533 | 339.556 | 827.089 |

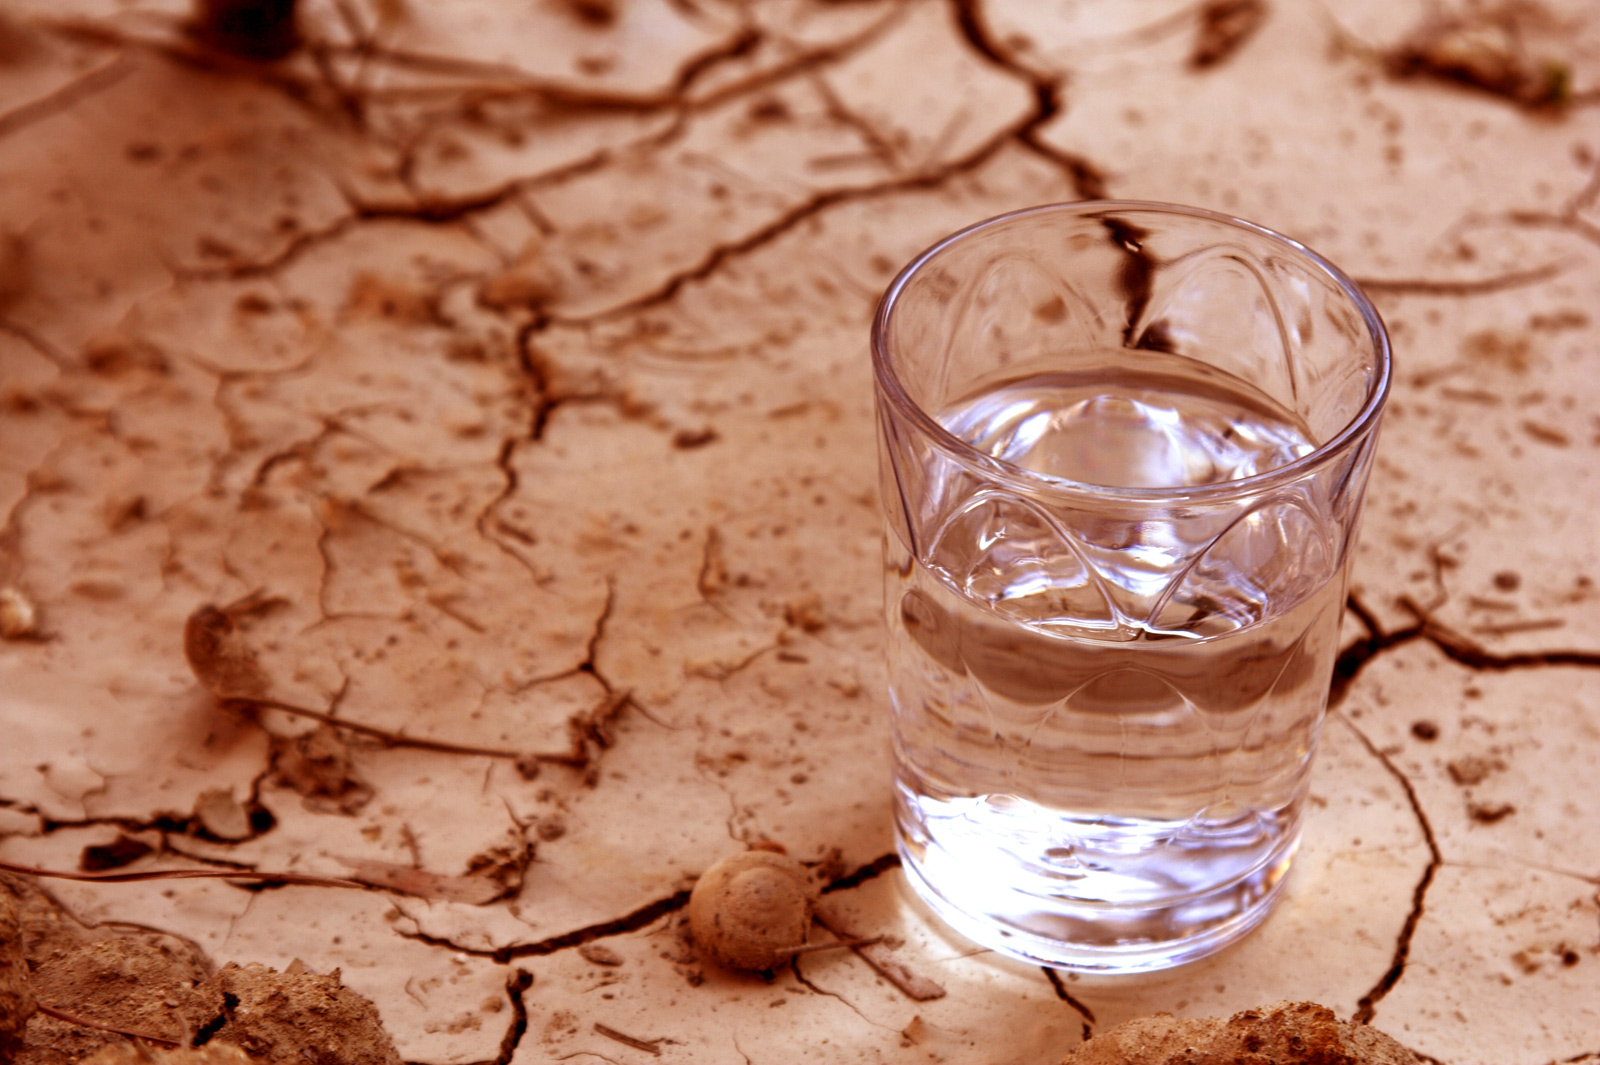
Save water!
Save it before you need it!
Water consumption in the world has increased over the last hundred years by more than six-times.
